Activity 3: Guide
SDS-PAGE Simulation
For us to have a better understanding of SDS-PAGE, we will be simulating it through the portal in the link. Please check the instructions below.
Instructions
1. Go to http://biomodel.uah.es/en/lab/SDS-PAGE/inicio.htm and you should be directed to this page.

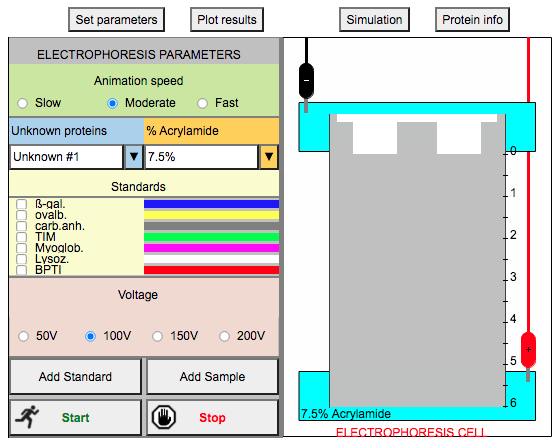
This program operates on HTML-5 so no additional installations are required. This program is good to go. You will only be manipulating the conditions on the panel shown below.

2. Choose your animation speed. It can be slow, moderate, or fast, depending on what's comfortable for you.
3. Let's do a sample run. Tick all the standards (7 in all). When you tick one, you can also click Protein Info to know more about the protein. Here are some details regarding the standards:
| Standard | MW (Da) |
|---|---|
| B-galactosidase | 116 107 |
| Ovalbumin | 42 734 |
| Carbonic anhydrase | 29 011 |
| Triose phosphate isomerase (TIM) | 26 527 |
| Myoglobin | 17 183 |
| Lysozyme | 14 296 |
| BPTI trypsin inhibitor | 6 500 |
4. Choose an unknown protein (there are 10 in total).
5. Use the following settings: 7.5% acrylamide, 100 V.
6. Click "Add Standard", then "Add Sample", then "Start"
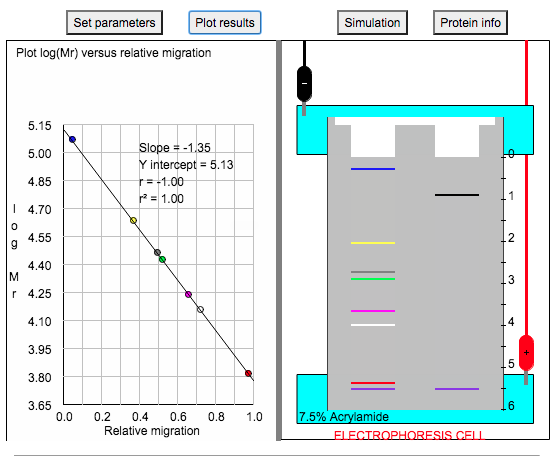
7. Click "Stop" when the first band is near the 5.5-unit mark.
8. Click "Plot Results" and this would show you the standard curve of the logMW vs Rf (relative migration).

9. If you click on the protein band (the black band in the figure boxed in red), the program will show you its relative migration (boxed in red).

10. Using the relative migration of the unknown protein, you can determine its molecular weight from the standard curve.
11. Now, for the real deal. Click "Set parameters" to go back to the settings page. Here are the things you will be doing to investigate how various parameters affect PAGE.
- Change in voltage
- Run all standards (any unknown protein will do because we are only interested in the migration of the protein standards) in a 7.5% polyacrylamide gel at a constant time frame (say 5s)
- Keeping all other parameters constant including the run time, run the gel at different voltage settings: 50V, 100V, 150V, 200V.
- Take a screenshot of the migration of the standards at each run for side-by-side comparison.
- Change in polyacrylamide concentration in the resolving gel
- Run all standards (any unknown protein will do because we are only interested in the migration of the protein standards) at 100V at a constant run time (say 5s)
- Keeping all other parameters constant including the run time, run the gel at different polyacrylamide concentrations: 7.5%, 10%, 12%, 15%.
- Take a screenshot of the migration of the standards at each run for side-by-side comparison.
What do you observe in the resolution (separation) and the rate of migration of the bands when you vary these parameters?
12. Determine the MW of all the unknown proteins (10 in all).
At the end of this simulation, you should have 3 sets of data.
- the side-by-side comparison of the gel profile when changing the voltage
- the side-by-side comparison of the gel profile when altering polyacrylamide concentration
- the MW of all the unknown proteins
